22°17′N · 114°10′E · HARBOUR CITY
Cortex Helix Field Academy
Evening annotation clinics where traders learn to mark Elliott wave structure on real charts — impulse degrees, corrective nesting, and the quiet discipline of a clean count.
Wave counts taught with pencil, not slogans
Our flagship Elliott Wave Annotation Clinic runs in small groups at Harbour City. You bring a chart you actually trade; we walk the labels from primary degree down to minute swings.
Included
Live chart markup
Facilitators annotate impulse waves (1–5), A–B–C corrections, and invalidation levels on projected charts while you copy the same marks on your printouts.
Outcome
A count you can defend
Leave with a dated annotation sheet, alternate scenarios noted in the margin, and a short checklist for the next session’s open.
Related sessions in the field academy
Supporting clinics for traders who want deeper corrective work or private chart review.
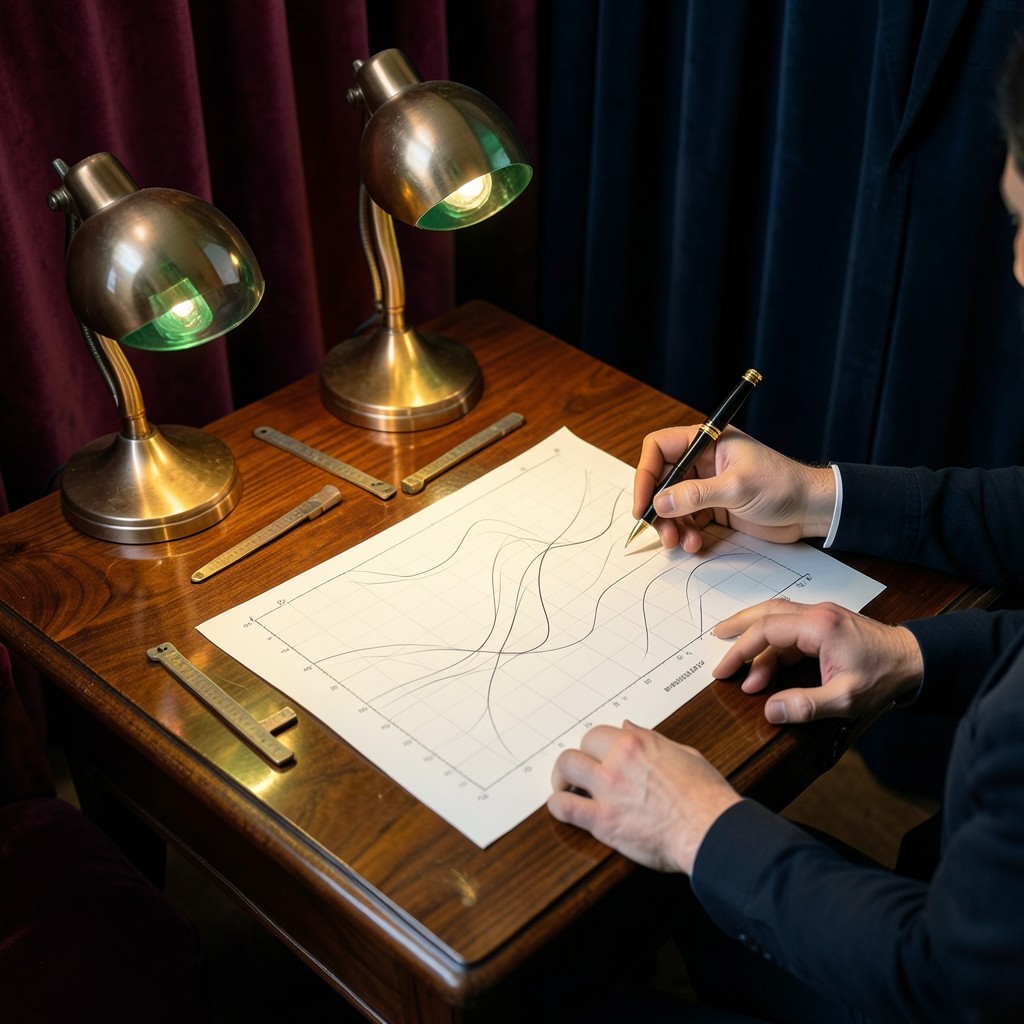
Elliott Wave Annotation Clinic
Small-group evening sessions marking impulse and corrective waves on charts you actually trade.
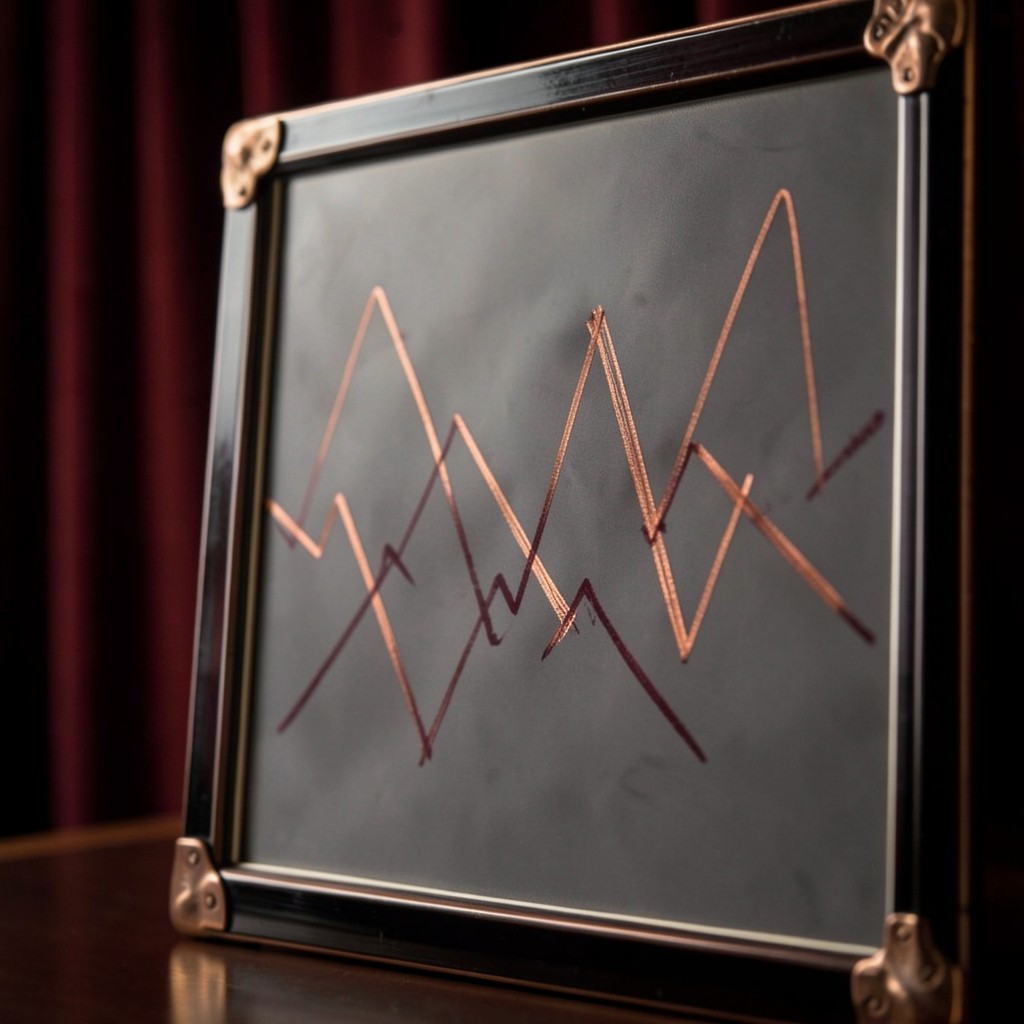
Corrective Structure Intensive
A focused half-day on zigzags, flats, triangles, and nested A–B–C labels inside larger impulse legs.
Private Chart Review
One-to-one annotation review of a single instrument’s recent structure with written alternate scenarios.
From the annotation table
“I arrived with a messy Hang Seng count full of overlapping labels. By the second hour we had a primary impulse and two alternate paths written in copper ink — and I finally knew which one I would abandon.”
“The clinic moves slower than webinars I have sat through, which is the point. We spent twenty minutes arguing over a single B wave. That argument saved me from sizing into a false breakout the following Monday.”
Recent notes from the academy
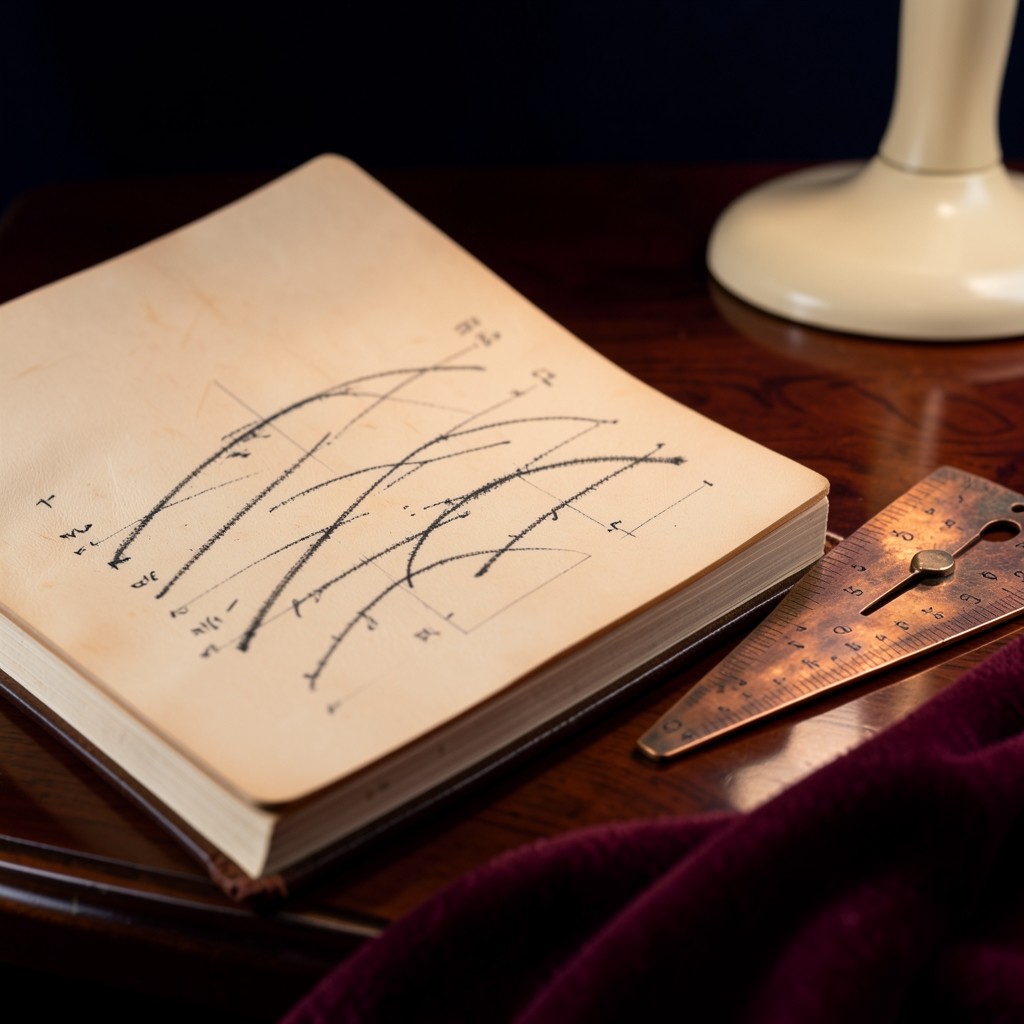
11 August 2026
Labelling degree before drawing lines
Why Elliott wave annotation clinics start with degree names before trendlines — a field note from our Tsim Sha Tsui studio.

2 July 2026
When a B wave pretends to be a third
A corrective trap we see often in Hang Seng annotation work, and how clinic markup exposes it.
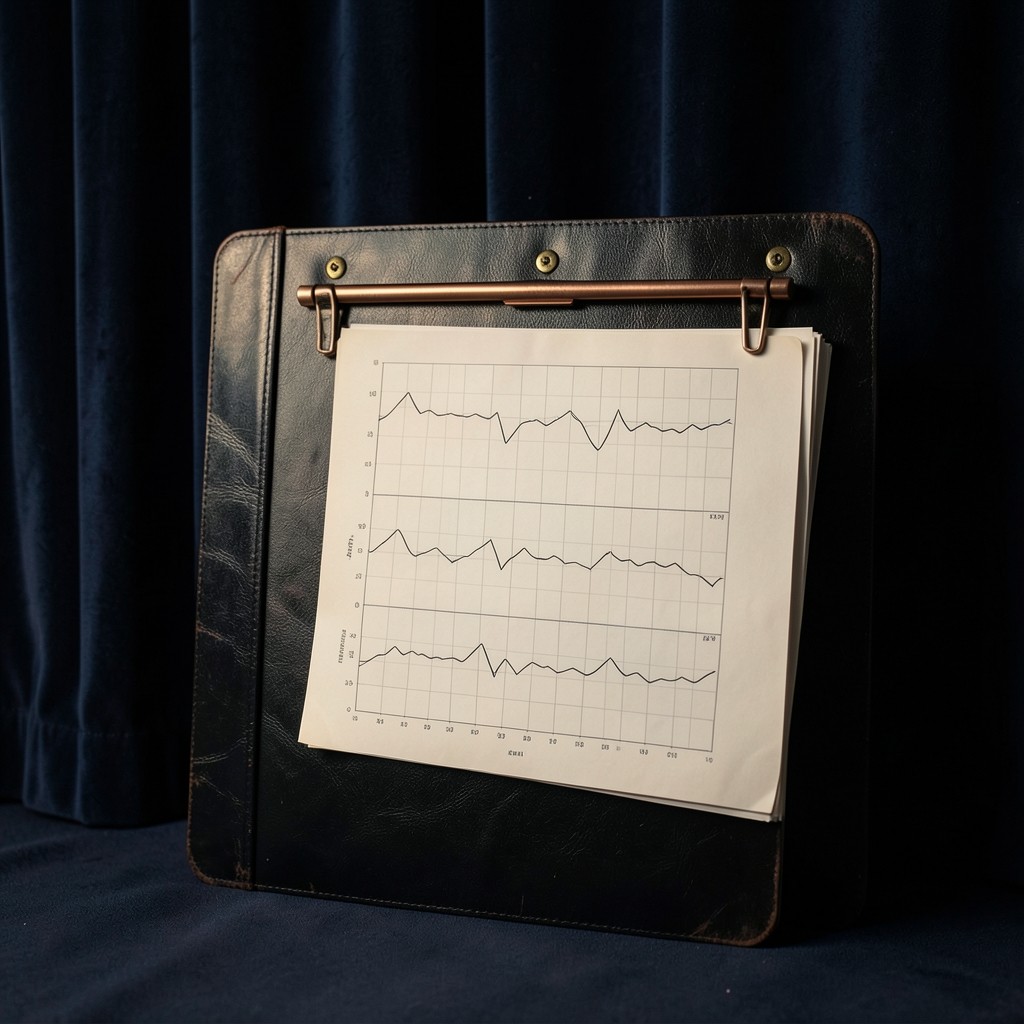
20 May 2026
Preparing charts for an evening clinic
What to print, crop, and mark before you take a seat at an Elliott wave annotation clinic in Hong Kong.